Zabbix and Pure Storage monitoring V2

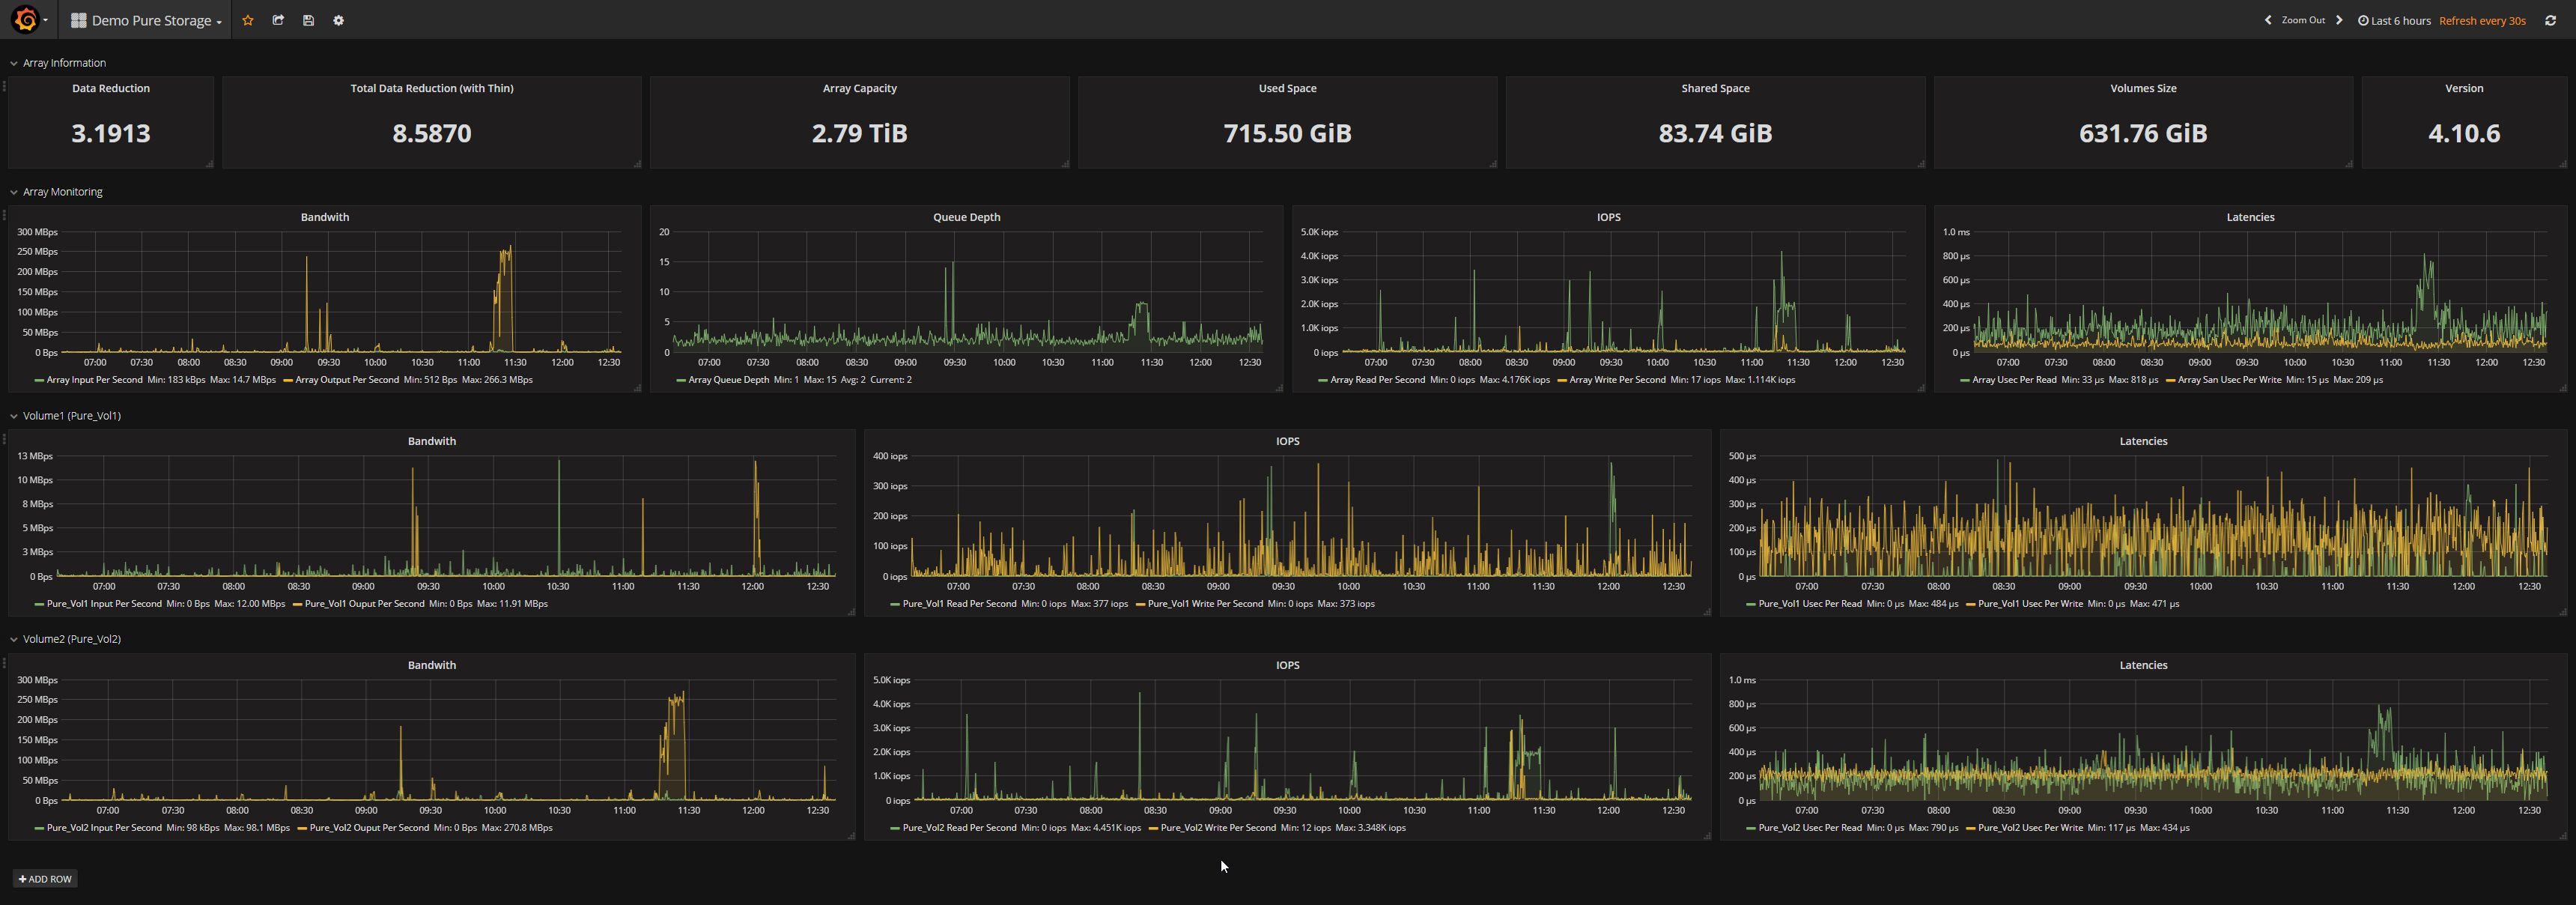
At the end of 2017, I’ve shared a post talking about Zabbix and Pure Storage monitoring. At this time we were using it as a POC. A few weeks later, we were so happy with the product that we decided to use it in production.

So it was an opportunity to rewrite my monitoring script from scratch.
It’s now time to share it with you.
If you want more information about the purpose, the way I’ve made the integration, etc. don’t hesitate to read my previous post as the only modifications are the code and the type of information the script can gather from the array.

Instead of writing a script for each part of the monitoring (volumes, array, disks,…), I’ve put everything in one file called “PureStorageMonitoring.py”.
The dependencies are still the same : purestorage and urllib3 libraries from Python and Python 3.x

A complete list of datas and triggers that will be gathered by the script is available at the end of this post.

Important note : This script has been tested with Zabbix 3.4.x and 4.0.x and Pure Storage 4.10.x and 5.1.x. I cannot guarantee that it will work fine with any other version even if I made my best regarding this point. The template available is exported from Zabbix 4.0.x so you will have to delete some settings to import it in Zabbix 3.4.x don’t hesitate to contact me in case of trouble.

Setup the proxy or server

To gather data, we need to make some works on the Zabbix Proxy or Zabbix Server.

  • Be sure that you have Python 3.x installed on the server
  • Install the pip packages
pip3 install purestorage urllib3 py-zabbix

Get API Token

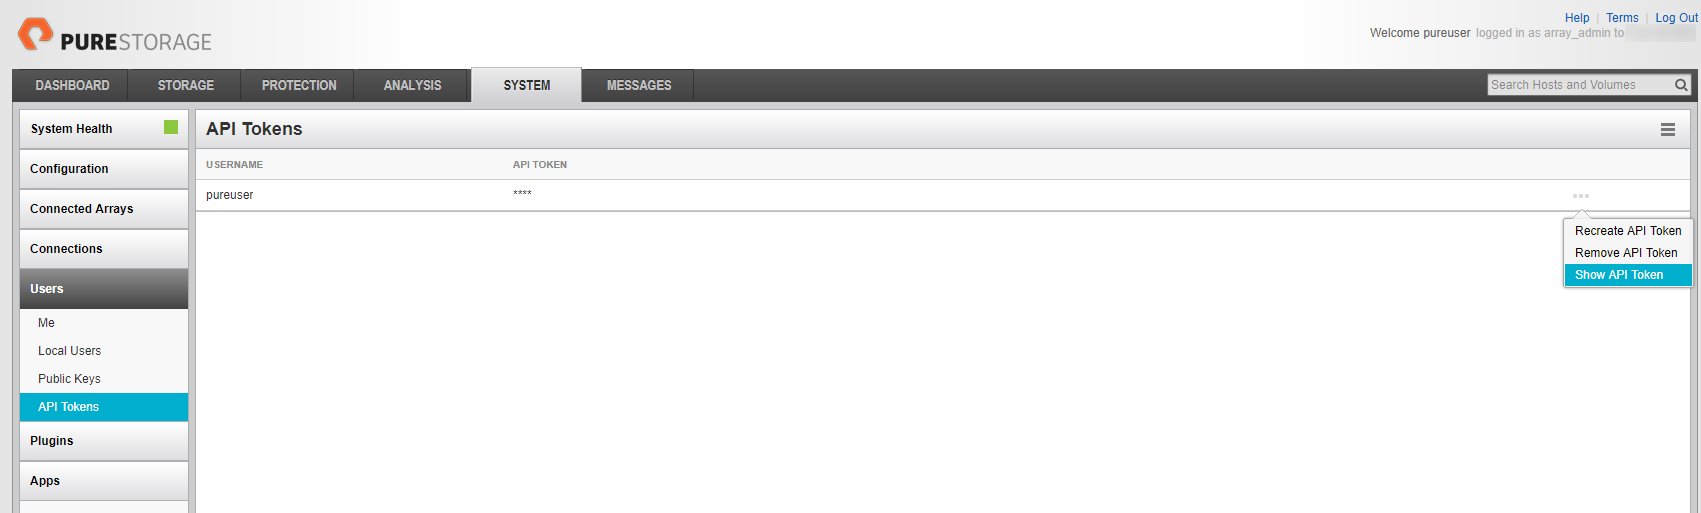
To be able to use the REST API of Pure Storage, you have to find your API Token on the web interface.
Go on “SYSTEM”, then “Users” and under the Users menu, you will find “API Tokens”. Click on the three dots on the right of the screens and use “Show API Token” to get your API Token.

Download the scripts

The script is available on my Github repository.
You can download it on the server using the following steps :

  • Find the directory where you have to download it, by looking at the value of “ExternalScripts” setting of your proxy or server (by default it’s “/usr/local/share/zabbix/externalscripts” but if like me you are using the official Debian packages from Zabbix, it will be “/usr/lib/zabbix/externalscritps”
  • Go to this directory
cd /usr/lib/zabbix/externalscripts
  • Download the scripts
wget https://raw.githubusercontent.com/jeremyverda/zabbix-public/master/Pure%20Storage/PureStorageMonitoring.py
  • Set the rights
chmod +x PureStorageMonitoring.py
chown zabbix:zabbix PureStorageMonitoring.py

Import the Zabbix template

You can find the Zabbix template on the Github repository.
You have to import it in Zabbix before you continue.

Configure the Zabbix host

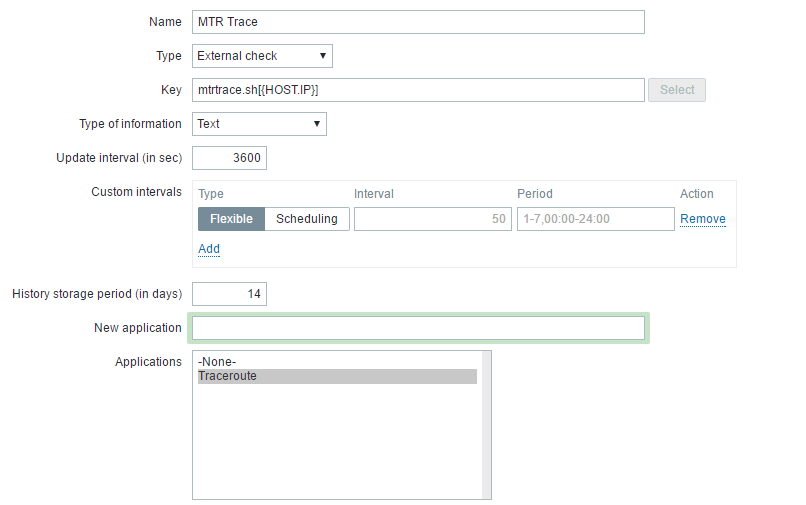
In the Zabbix frontend, add a new host and set the information as follows :

  • Agent interface IP : Fill in with the IP address of your Pure Storage
  • Macros
    • {$PURE_TOKEN_API} : Fill in with the API Token that you have copy previously
    • {$PURE_ZBX} : WIll be the IP of your Zabbix Proxy or server that will be used by the Zabbix Sender. By default it will be 127.0.0.1
  • Monitored by proxy : Set this field if you are going to use a Zabbix proxy
  • Template : select the previously imported template : “Template Pure Storage”

Wait for the data

Once you have completed all the previous steps, you have to wait until the data are gathered by the script.

Data and triggers

Here is the list of data and triggers the script will gather from your Flash Array :

Data

  • Global
    • latencies
    • read and write
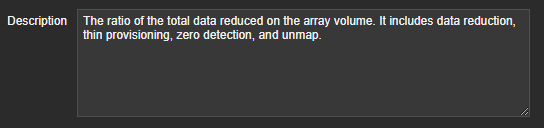
    • data reduction ratio
    • array capacity, volume size, used space and shared space
    • version
    • remote assist
    • phone home
    • hostname
    • etc.
  • Volumes
    • size and used size
    • read and write
    • latencies
    • data reduction
    • etc.
  • Hosts (value corresponding to VMware or any other hosts connected to the array)
    • latencies
    • read and write
  • Disks
    • capacity
    • last failure (currently this value won’t be empty but it will be corrected on a future API and Purity version)
    • protocol
    • status
    • type

Triggers

  • Global
    • Phone home is disabled
    • Remote assist is enabled
  • Volume
    • Volume size has changed
  • Disks
    • Error on disk status

This list will be updated for each data or trigger that will be added in the template. Don’t hesitate to ask me to add something if you need it.

Update

  • 01/11/2018 :
    • Replace the Zabbix Sender by a Python Library
    • Increase the delay between each check
    • Get more value at each check instead of requiring more check to get the same amount of values

Zabbix and Pure Storage monitoring

WARNING : A complete rewrite of this script has been made.
You can find it here : Zabbix and Pure Storage monitoring V2

A few weeks ago, at work, we have started a new POC for one of our infrastructure with a Pure Storage FlashArray.

To be able to give information about this POC to everybody inside the team, we needed a dashboard. So with the help of Flash Array Rest API, Zabbix and Grafana, I produced this dashboard :

Please, bear in mind : These scripts and the Zabbix template are a "Work in progress". Currently we are on a POC and not yet in production so other elements will be added (triggers, items, etc.) and this post will be updated.

Zabbix integration

The Zabbix integration is made of :

  • Python scripts and libraries
  • FlashArray Rest API
  • Zabbix Sender (with Trapper items)
  • Zabbix ExternalScripts (executed on Zabbix Server or Proxy)
  • Low-Level discovery
  • Zabbix Macro

There are four scripts :

  • LLD_PureVolume.py
  • PureArrayInfo.py
  • PureArrayMonitor.py
  • PureVolumeMonitor.py

How it works

There are two parts in the Zabbix template :
  • Discovery rules
  • Static items
The LLD_PureVolume.py is responsible of the discovery rule. Zabbix will use it to get the list of existing volumes on the FlashArray and will create the corresponding items. The PureArrayInfo.py and PureArrayMonitor.py are responsible of gathering the data from the Array point of view. The PureVolumeMonitor.py is responsible of gathering data from the volume point of view using the items that will be created by the discovery rules. As all the data are in the same JSON output when we query the FlashArray API, the scripts will gather all information at the same time and will use the Zabbix Sender to populate all the Trapper items at each execution instead of launching the scripts for each items. The scripts will return “1” at the end and store it in an item called “Pure Array Info Launch”,”Pure Array Monitoring Launch” or “VolumeName Monitoring Launch”.

Be ready

Important note : We are using Zabbix 3.4.x. So you could face some problems while importing the template. Let me know if it’s the case.

Before we start with the integration into Zabbix, be sure to have the following tools installed on your Zabbix Proxy or Server :

  • Python 3.x
  • purestorage and urllib3 libraries You can install them on your system by running the following command :
    pip install purestorage urllib3
    or (if your default Python version is not Python 3.x)
    pip3 install purestorage urllib3
  • Zabbix Sender You can install it with the following command :
    apt install zabbix-sender

Get the necessary information

Before going further, you will need to gather the following information from your Pure Storage FlashArray :

  • IP
  • API Token

To get the API Token, open your Flash Array web interface and go on "API Tokens" menu under the "Users" menu that you will find in the "SYSTEM" tab.

You will see a list of users and three dots on the right of the screen. Click on it and finally select "Show API Token"


Let's start

If your system is ready and you have all the information at hand, let's start the integration on your system.

Download the scripts and the template

All the scripts and template are available on my GitHub repository. Download all those files and put the scripts on your ExternalScripts directory on your Zabbix Proxy or Server. By default this directory is : /usr/local/share/zabbix/externalscripts but check your Zabbix configuration file if you have any doubt. By example, we are using the official Zabbix packages for Debian and this directory is /usr/lib/zabbix/externalscripts

Set the good rights

To allow Zabbix to execute those scripts you must allow them to be executed and owned by the Zabbix user on your system. You can execute the following commands (under the ExternalScripts directory) :

chmod +x LLD_PureVolume.py PureArrayInfo.py PureArrayMonitor.py PureVolumeMonitor.py
chown zabbix:zabbix LLD_PureVolume.py PureArrayInfo.py PureArrayMonitor.py PureVolumeMonitor.py

Create a new Zabbix host

Once you have imported the template, you can create a new host and fill the following information :
  • Agent interfaces IP address : Fill in with the IP address of your Pure Storage FlashArray
  • Macros
    • {$PURE_TOKEN_API} : Fill in with the API Token that you have gathered from the FlashArray web interface
    • {$PURE_ZBX} : Will be the IP of your Zabbix Proxy or Server that will be used by the Zabbix Sender. By default it’s set to “127.0.0.1”
  • Monitored by proxy : Set this field if you put the scripts on a proxy.

It’s done

Once you have done all those steps, you have to wait until the data are gathered from the Pure Storage FlashArray.

Items explanation

If you some question about the meaning of some items, you will find a description of each items in the description of each one. Example :

Feedback

If you have any remarks or question about those scripts or the Zabbix template, you are welcome in the comments section or by using the contact form.

Traceroute with Zabbix and MTR

At the company I work for, we are using Zabbix to monitor our infrastructure and in some case we are using “traceroute” to keep an eye on our network from different locations.

By keeping a traceroute history, it can help you to understand some networking problem by example when you are facing packet loss from some location.

To keep this history in Zabbix, we are using “MTR” instead of the traditional “traceroute” command.

Here is a small explanation of what MTR is, taken from the Github page of the project :

mtr combines the functionality of the ‘traceroute’ and ‘ping’ programs
in a single network diagnostic tool.

As mtr starts, it investigates the network connection between the host
mtr runs on and a user-specified destination host. After it
determines the address of each network hop between the machines,
it sends a sequence of ICMP ECHO requests to each one to determine the
quality of the link to each machine. As it does this, it prints
running statistics about each machine. 

Here is an example of the command output :

MTR is installed on our Zabbix proxies and on the main server.

Under Debian, the command to install MTR is :

sudo aptitude install mtr

As we are using proxies and active agents, the remote commands are not supported. So we have deployed a local script on the server and proxies.

Here is the local script :

#!/usr/bin/env bash
IP=$1
mtr -r -c3 -w -b $IP

This local script is named “mtrtrace.sh” and is saved under the “externalscripts” directory of Zabbix. The path can be found in the proxy or server configuration file under the following configuration key : “ExternalScripts“. Under Debian it’s “/usr/lib/zabbix/externalscripts“.

Once you have created the file, you have to allow Zabbix to execute it by using the following commands :

chmod +x mtrtrace.sh
chown zabbix:zabbix mtrtrace.sh

Then import the following template in Zabbix web interface and link it to a host :

If you prefer to add it in an existing template, here are the settings :

It will use the first ” IP address” in the “Agent interfaces” part of the host configuration.

You will find the history of data under the application “Traceroute” and in the item ” MTR Trace” on the “Latest data” tab of the configured host.

Here is an example of data from this tab :

Please note that, it’s recommended to increase the “Timeout” value in the Zabbix Server and Proxies configuration files to use this script. On my side it takes 10 seconds in average to be completely executed.