At the company I work for, we are using Zabbix to monitor our infrastructure and in some case we are using “traceroute” to keep an eye on our network from different locations.
By keeping a traceroute history, it can help you to understand some networking problem by example when you are facing packet loss from some location.
To keep this history in Zabbix, we are using “MTR” instead of the traditional “traceroute” command.
Here is a small explanation of what MTR is, taken from the Github page of the project :
mtr combines the functionality of the ‘traceroute’ and ‘ping’ programs
in a single network diagnostic tool.As mtr starts, it investigates the network connection between the host
mtr runs on and a user-specified destination host. After it
determines the address of each network hop between the machines,
it sends a sequence of ICMP ECHO requests to each one to determine the
quality of the link to each machine. As it does this, it prints
running statistics about each machine.
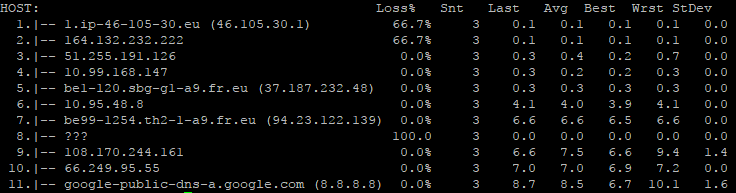
Here is an example of the command output :
MTR is installed on our Zabbix proxies and on the main server.
Under Debian, the command to install MTR is :
sudo aptitude install mtr
As we are using proxies and active agents, the remote commands are not supported. So we have deployed a local script on the server and proxies.
Here is the local script :
#!/usr/bin/env bash
IP=$1
mtr -r -c3 -w -b $IP
This local script is named “mtrtrace.sh” and is saved under the “externalscripts” directory of Zabbix. The path can be found in the proxy or server configuration file under the following configuration key : “ExternalScripts“. Under Debian it’s “/usr/lib/zabbix/externalscripts“.
Once you have created the file, you have to allow Zabbix to execute it by using the following commands :
chmod +x mtrtrace.sh
chown zabbix:zabbix mtrtrace.sh
Then import the following template in Zabbix web interface and link it to a host :
- MTR History (exported from Zabbix 3.2.x)
- MTR History (exported from Zabbix 4.0.x)
If you prefer to add it in an existing template, here are the settings :
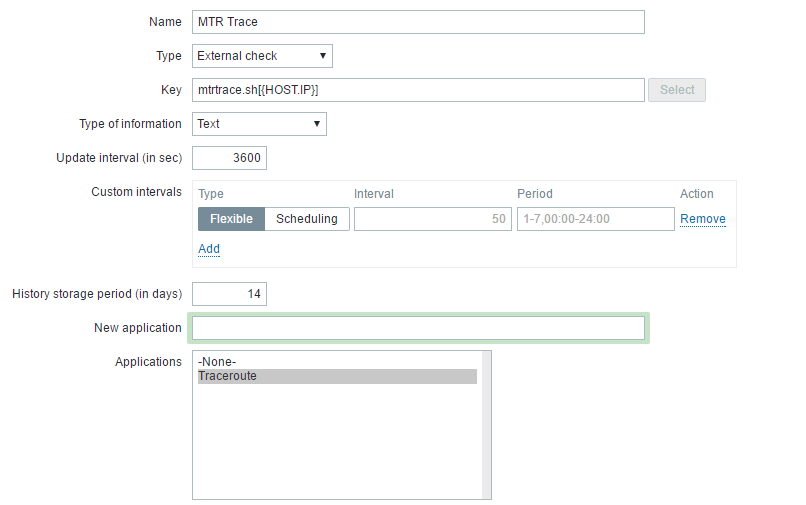
It will use the first ” IP address” in the “Agent interfaces” part of the host configuration.
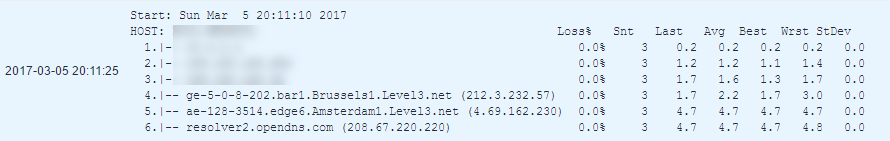
You will find the history of data under the application “Traceroute” and in the item ” MTR Trace” on the “Latest data” tab of the configured host.
Here is an example of data from this tab :
Please note that, it’s recommended to increase the “Timeout” value in the Zabbix Server and Proxies configuration files to use this script. On my side it takes 10 seconds in average to be completely executed.